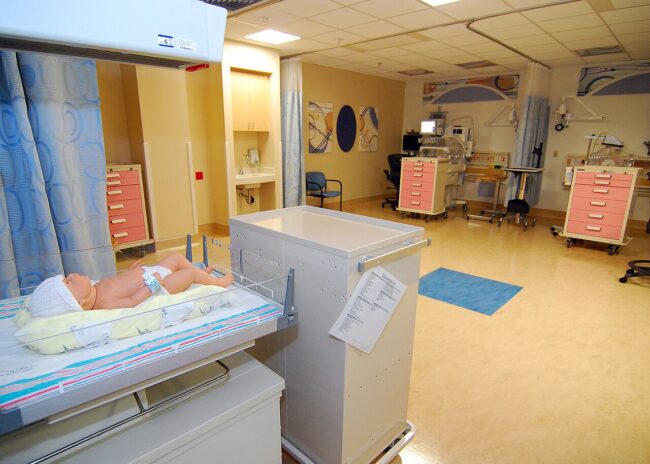
Mock set-up of a neonatal intensive care unit pod at Naval Medical Center San Diego. Photo: U.S. Navy, public domain.
Quick Answer: South Florida-based Pediatrix Medical Group, a national provider of newborn, maternal-fetal and pediatric physician services, reported third-quarter 2026 net revenue of $501.4 million, up 1.7%, and adjusted EPS of $0.72, up from $0.67. Adjusted EBITDA slipped to $85.5 million, and the company bought back $83 million of stock. It expects 2026 adjusted EBITDA of $290 million to $300 million.
Pediatrix Medical Group is a South Florida-based physician services company. Through about 4,300 affiliated physicians and other clinicians, it provides care in hospital neonatal intensive care units, maternal-fetal medicine practices and pediatric subspecialty offices. Its results offer a view of trends in newborn care, physician reimbursement and the economics of hospital-based medical groups.
Pediatrix released third-quarter 2026 results on October 29, issuing them from Fort Lauderdale. The quarter showed modest revenue growth, better-than-expected pricing and volume, a favorable shift toward commercial insurance, lower GAAP earnings and continued share repurchases. This analysis breaks down each part of the report.
How does Pediatrix’s business work?
Pediatrix’s revenue comes mainly from professional fees for physician services. Its neonatologists staff hospital neonatal intensive care units, caring for premature and critically ill newborns. Its maternal-fetal medicine specialists treat high-risk pregnancies, and its pediatric subspecialists see children in office settings. The company reports two broad volume categories, hospital-based and office-based services, plus NICU days as a separate measure of neonatal activity.
Because hospital-based neonatal care is the largest part of the business, NICU days are closely watched. When fewer newborns need intensive care, Pediatrix’s volume can decline even if its pricing holds. That is why the company reports volume and reimbursement separately, so investors can see whether revenue growth is coming from more patients or from higher payments per patient. In 2026, those two drivers have moved in opposite directions from one quarter to the next.
What did Pediatrix report for the third quarter of 2026?
Net revenue rose $8.5 million, or 1.7%, to $501.4 million from $492.9 million a year earlier. Net income fell to $47.0 million, or $0.59 per diluted share, from $71.7 million, or $0.84 per share. On an adjusted basis, which excludes certain items, EPS rose to $0.72 from $0.67. Adjusted EBITDA was $85.5 million, compared with $87.3 million.
Chief Executive Officer Mark S. Ordan said, “We are pleased with our results this quarter, driven by both volume and pricing performing ahead of our expectations.” He added, “We continue to push operating efficiency paired with sector leading care quality.”
Pediatrix Q3 2026 at a glance
| Metric | Q3 2026 | Q3 2025 | Change |
|---|---|---|---|
| Net revenue | $501.4M | $492.9M | +1.7% |
| Same-unit revenue growth | +0.6% | n/a | n/a |
| Net income | $47.0M | $71.7M | -34% |
| Diluted EPS | $0.59 | $0.84 | -30% |
| Adjusted EPS | $0.72 | $0.67 | +7% |
| Adjusted EBITDA | $85.5M | $87.3M | -2% |
| Operating cash flow | $117.7M | $138.1M | -15% |
| Share repurchases | $83.0M | n/a | n/a |
Source: Pediatrix Medical Group Q3 2026 earnings release, October 29, 2026.
Where did revenue growth come from?
Pediatrix breaks revenue growth into same-unit growth, from practices it operated in both periods, and non-same-unit growth, from acquisitions and dispositions. Same-unit revenue rose just 0.6%, made up of 0.3 percentage points from reimbursement-related factors, such as pricing and payer mix, and 0.3 points from patient volume. Non-same-unit growth added 1.1 points, driven by recent acquisitions and partly offset by practices the company exited.
Pediatrix revenue growth components, Q3 2026
| Component | Contribution |
|---|---|
| Reimbursement-related factors | +0.3 points |
| Patient volume | +0.3 points |
| Same-unit revenue growth | +0.6% |
| Non-same-unit (acquisitions net of dispositions) | +1.1 points |
| Total net revenue growth | +1.7% |
Source: Pediatrix Q3 2026 release.
The reimbursement contribution reflects a combination of pricing, the terms Pediatrix negotiates with insurers and administrative fee actions. Panabee’s analysis described these pricing levers as having “practical ceilings,” meaning they cannot keep driving growth indefinitely, which is why the return of volume growth matters.
The company also cited a favorable shift in payer mix. The share of revenue from commercial insurers and other non-government payers rose 70 basis points from a year earlier. Commercial insurers generally pay physicians more than government programs such as Medicaid for the same services, so even a small shift toward commercial coverage can lift revenue per patient.
How are patient volumes trending?
Volumes were mixed. Hospital-based patient services, the core of Pediatrix’s neonatal business, declined 0.3% in the third quarter and 1.2% for the first nine months. Neonatal intensive care unit days, a key measure for the company, fell 0.1% in the quarter and 1.1% year to date. Office-based patient services, which include maternal-fetal medicine and pediatric subspecialty visits, grew 2.9% in the quarter, though they were down 0.6% for the nine months.
Pediatrix same-unit volume trends
| Service | Q3 2026 | Nine months 2026 |
|---|---|---|
| Hospital-based patient services | -0.3% | -1.2% |
| Office-based patient services | +2.9% | -0.6% |
| NICU days | -0.1% | -1.1% |
Source: Pediatrix Q3 2026 release.
The third-quarter volume figures were better than the year-to-date trend, which is consistent with Ordan’s comment that volume performed ahead of expectations. Neonatal volumes depend heavily on the number of births and on how many newborns require intensive care, factors largely outside the company’s control.
How did the third quarter compare with the second?
The quarterly comparison shows a business whose volumes are stabilizing while pricing gains are moderating. In the second quarter, reported August 4, Pediatrix posted revenue growth of 4.0% to $487.8 million, with same-unit growth of 1.9%. That came from a strong 4.0-point contribution from reimbursement-related factors, offset by a 2.1-point decline in patient volume. Hospital-based services fell 2.8% and NICU days fell 3.2% in that quarter.
In the third quarter, the picture flipped. Volume turned slightly positive at 0.3 points, with NICU days down only 0.1% and office-based services up 2.9%, while the reimbursement contribution narrowed to 0.3 points. Revenue was higher in dollars, at $501.4 million versus $487.8 million, and adjusted EBITDA rose sequentially to $85.5 million from $76.4 million.
Pediatrix quarterly trend, 2026
| Measure | Q2 2026 | Q3 2026 |
|---|---|---|
| Net revenue | $487.8M (+4.0%) | $501.4M (+1.7%) |
| Same-unit revenue growth | +1.9% | +0.6% |
| Reimbursement contribution | +4.0 points | +0.3 points |
| Volume contribution | -2.1 points | +0.3 points |
| Hospital-based services | -2.8% | -0.3% |
| Office-based services | -1.2% | +2.9% |
| NICU days | -3.2% | -0.1% |
| Adjusted EPS | $0.63 | $0.72 |
| Adjusted EBITDA | $76.4M | $85.5M |
| Share repurchases | $42.7M | $83.0M |
| 2026 adjusted EBITDA outlook | $280M to $300M | $290M to $300M |
Sources: Pediatrix Q2 and Q3 2026 earnings releases.
In August, Ordan said, “Our strong results this quarter were in line with our expectations,” and that “we believe we have exceptional financial flexibility to fund organic growth initiatives.” By the third quarter, the company had nearly doubled its pace of share repurchases, from $42.7 million to $83.0 million.
Why did GAAP earnings fall while adjusted EPS rose?
GAAP net income fell 34% even as adjusted EPS rose 7%. The difference reflects items excluded from adjusted results, which the release reconciles. Adjusted EBITDA, which removes interest, taxes, depreciation, amortization and other items, declined about 2%, a smaller drop than GAAP earnings.
Adjusted EPS also benefited from a lower share count as Pediatrix repurchased stock. Fewer shares outstanding means the same adjusted earnings are divided among fewer shares, raising per-share results.
Costs remain a pressure point. Panabee’s analysis of the release reported that clinical salaries and benefits rose $9.2 million to about $342 million, an increase larger than the $8.5 million rise in revenue. Physician compensation is the largest expense for a medical group, so wage growth that outpaces revenue squeezes margins.
How profitable is Pediatrix?
Adjusted EBITDA margins, calculated by dividing adjusted EBITDA by net revenue, show profitability holding in a fairly narrow range. The third-quarter margin was about 17.1%, down from about 17.7% a year earlier, as revenue grew but adjusted EBITDA slipped. The second-quarter margin was about 15.7%, roughly in line with 15.6% a year earlier. For the first nine months, the margin was about 15.0%, up slightly from about 14.8%.
Pediatrix adjusted EBITDA margin (calculated)
| Period | 2026 | 2025 |
|---|---|---|
| Second quarter | About 15.7% | About 15.6% |
| Third quarter | About 17.1% | About 17.7% |
| First nine months | About 15.0% | About 14.8% |
Calculated from adjusted EBITDA and net revenue reported in Pediatrix’s Q2 and Q3 2026 releases.
Another way to size the business is revenue per clinician. Dividing third-quarter revenue of $501.4 million by about 4,300 affiliated clinicians gives roughly $117,000 per clinician for the quarter, or about $466,000 a year on a run-rate basis, based on those figures. The calculation is a simple average across physicians and other clinicians in different specialties.
How did Pediatrix perform over the first nine months?
For the first nine months, revenue rose about 3% to $1,465.4 million from $1,420.1 million. Adjusted EBITDA increased to $220.1 million from $209.7 million, about 5%, and adjusted EPS rose to $1.78 from $1.54, about 16%. GAAP net income was $116.4 million, or $1.43 per share, compared with $131.7 million, or $1.54 per share.
Pediatrix nine-month results
| Metric | 9M 2026 | 9M 2025 | Change |
|---|---|---|---|
| Net revenue | $1,465.4M | $1,420.1M | +3.2% |
| Net income | $116.4M | $131.7M | -11.6% |
| Diluted EPS | $1.43 | $1.54 | -7.1% |
| Adjusted EPS | $1.78 | $1.54 | +15.6% |
| Adjusted EBITDA | $220.1M | $209.7M | +5.0% |
Source: Pediatrix Q3 2026 release. Percent changes calculated.
How strong is Pediatrix’s balance sheet?
Pediatrix ended the quarter with $311.9 million of cash and equivalents, down from $375.2 million at the end of 2025, plus $113.9 million of short-term investments. Total debt was $578 million, made up of $400 million of 5.375% senior notes due 2030 and $178 million under a term loan. Its $450 million revolving credit facility was undrawn.
Subtracting cash from debt gives net debt of about $266 million, or roughly 0.9 times the midpoint of the company’s 2026 adjusted EBITDA outlook, based on those figures. Including short-term investments, net debt would be lower still. That leverage level leaves room for continued buybacks and acquisitions.
Pediatrix balance sheet, September 30, 2026
| Item | Amount |
|---|---|
| Cash and equivalents | $311.9M |
| Short-term investments | $113.9M |
| 5.375% senior notes due 2030 | $400M |
| Term A loan | $178M |
| Total debt | $578M |
| Revolving credit facility (undrawn) | $450M |
| Net accounts receivable | $231.8M |
Operating cash flow from continuing operations was $117.7 million in the quarter, down from $138.1 million, and capital expenditures were just $4.4 million. Low capital needs are typical of a physician services business, which does not own hospitals or major equipment. Pediatrix used $83.0 million to repurchase shares during the quarter.
What is Pediatrix’s 2026 outlook?
Pediatrix expects 2026 adjusted EBITDA of $290 million to $300 million, raising the low end from the $280 million to $300 million range it reaffirmed in August. The midpoint moved up $5 million to $295 million. The release reconciles that range to implied net income of $153.5 million to $160.8 million and an income tax provision of $56.8 million to $59.5 million.
Through nine months, adjusted EBITDA was $220.1 million, so the outlook implies fourth-quarter adjusted EBITDA of roughly $70 million to $80 million, based on those figures. That would be below the third quarter’s $85.5 million.
What should readers watch next?
Several measures will show whether the third quarter’s improvement continues. The first is NICU days, which nearly stopped declining in the third quarter after falling 3.2% in the second. The second is the reimbursement contribution, which shrank from 4.0 points to 0.3 points between the two quarters. The third is fourth-quarter adjusted EBITDA, which the full-year outlook implies will land between roughly $70 million and $80 million. Finally, the pace of share repurchases and acquisitions will show how management is using its financial flexibility.
Brian’s Take
What I notice in Pediatrix’s numbers this year is the handoff between price and volume. In the second quarter, pricing did the heavy lifting while volumes fell. In the third quarter, volumes stopped shrinking, but pricing added much less. A physician group can’t raise prices forever, so steadier NICU volumes matter.
The balance sheet gives management room to work. With $578 million of debt, more than $300 million of cash and an untouched $450 million credit line, the company nearly doubled its buybacks this quarter.
The number I’d watch is salary costs. Clinical salaries and benefits grew a little faster than revenue this quarter, and in a business built on physicians, that is the line that decides margins.
Frequently Asked Questions
What does Pediatrix Medical Group do?
Pediatrix provides newborn, maternal-fetal and pediatric physician services through about 4,300 affiliated physicians and other clinicians.
What were Pediatrix’s Q3 2026 results?
Net revenue rose 1.7% to $501.4 million, adjusted EPS was $0.72 and adjusted EBITDA was $85.5 million.
Are NICU volumes growing?
No. NICU days fell 0.1% in the third quarter and 1.1% for the first nine months of 2026, though the third-quarter decline was much smaller than the 3.2% drop in the second quarter.
What is Pediatrix’s 2026 guidance?
Adjusted EBITDA of $290 million to $300 million.
How much debt does Pediatrix have?
$578 million at September 30, 2026, against $311.9 million of cash and an undrawn $450 million revolver.
Did Pediatrix raise its 2026 outlook?
Yes. It raised the low end of its adjusted EBITDA range to $290 million from $280 million, keeping the high end at $300 million.
Sources and Further Reading
- Pediatrix Medical Group, Inc., Third Quarter 2026 Results, Form 8-K Exhibit 99.1, October 29, 2026 – U.S. Securities and Exchange Commission
- Pediatrix Medical Group, Inc., Second Quarter 2026 Results, Form 8-K Exhibit 99.1, August 4, 2026 – U.S. Securities and Exchange Commission
- Panabee, “Pediatrix Revenue Grows 3% Amidst Cash Flow and Regulatory Pressures,” October 2026